

The Fatal Flaw With Absorption Rate Pricing (Part 3 of 3)

This is the final part of the three-part series of “The Fatal Flaw with Absorption Rate Pricing.” In Part 1, we discussed what Absorption Rate Pricing is, how it is used to “project” the next few months (based on previous data), and how to calculate it. In summary, Absorption Rate Pricing is looking at the Absorption Rate and the Months’ supply to determine if the market is increasing of declining. You calculate the Absorption Rate for the previous 3 months, 6 months, and the 12 months and determine if the Absorption Rate is increasing or decreasing. This will help you determine if the market is increasing or declining. Once you understand if the market is increasing or declining you can use this information to help create your pricing strategy.
In Part 2, we discussed the fatal flaw in the Absorption Rate Pricing Process and how to predict if this flaw will impact your Absorption Rate Pricing Analysis. Basically, you need to evaluate the Buying Pattern. If you have a strong Buying Pattern, or there is a seasonal market, you may encounter a problem with the Absorption Rate Pricing Analysis somewhat depending on the time of the year you are doing your analysis and how that relates to your Buying Pattern.
So, what can you do? We will discuss the process we recommend to real estate agents in over 500 MLS areas throughout the US and Canada. As we discussed earlier, the goal of the Absorption Rate Pricing is that you will need to “project” the sales for the next few months, and then determine how the subject property compares to the competition so that you can determine your opportunity to sell your listing.
So, if the Absorption Rate Pricing Analysis that we discussed isn’t dependable, what do we recommend? We recommend making use of the Visual Pricing System’s Projected Pond.
Before we discuss the Projected Pond, let’s walk through the Real Estate Pond so that you can understand the key concepts of Accumulation Rate and Absorption Rates and how they are represented. Below is an example of a Real Estate Pond.
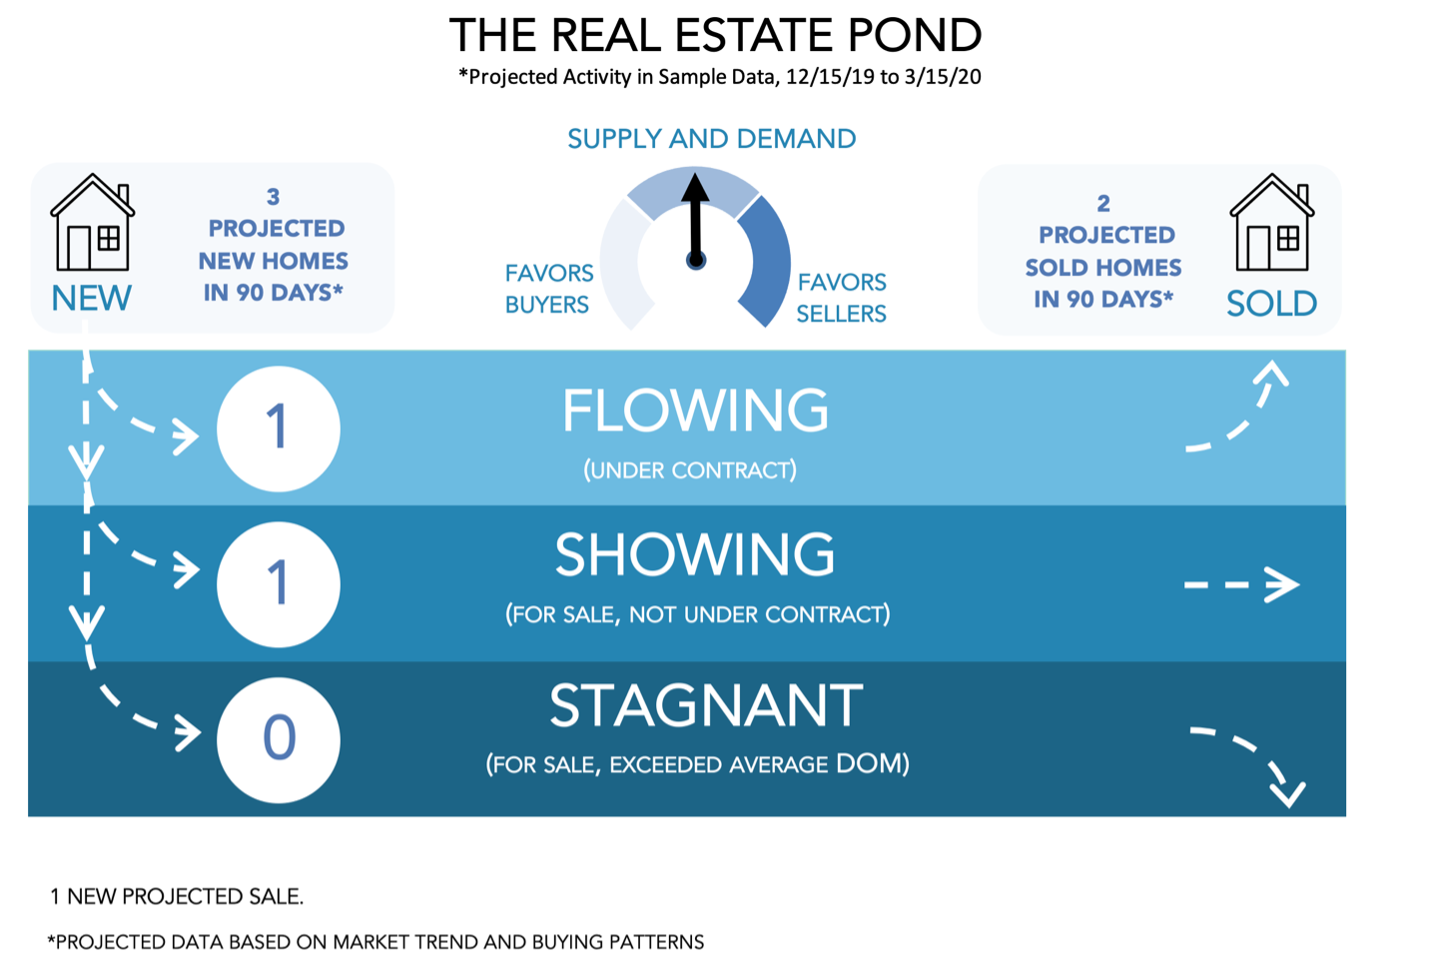
This is a great visual for people who don’t understand graphs and charts, and it’s a great visual for folks that do. It makes the analogy with water flowing in and out of a pond to the real estate market. So, in the case of a pond, you have water that flows into the pond and water that is flowing out of the pond. If you get more water that flows into a pond than what is flowing out of the pond, the pond starts to fill up. If you get more water that is flowing out of the pond than that which is flowing in, then the pond starts to empty out. As water “sits” in the pond, some of the water tends to sink to the bottom of the pond and sit there. Water at the top of the pond is generally the water that “flows” in and out of the pond. Water that settles at the bottom becomes stagnant water and becomes part of the muck.
The analogy between Real Estate and The Pond are easily seen. Just as water flows in and out of a pond, in Real Estate, homes come on and off the market. The best homes (homes that are priced right for the value they have) come on the market, float along the top of the Real Estate Pond, then go under contract and flow out of the market in a timely fashion. The properties that are shown in the “Flowing” area, are the properties that are currently under contract (are flowing) and will exit the Real Estate Pond.
The properties that are in the “Showing” and “Stagnant” area, are the properties that are for sale and that are not under contract.
Homes that don’t show well, or are not priced for the value they have, will come on the market, and sit there for a while. Eventually they will sink to the bottom of the pond, and become part of the stagnant mass, and will result in an expired or withdrawn listing. The properties that are in the “Stagnant” area are homes that have been on the market for quite some time (longer than the average days on the market for that area) and will likely not sell.
How quickly homes are coming on the market and into the Real Estate Pond, can be referred to as the Accumulation Rate. The rate of which homes are sold and coming off the market and leaving the Real Estate Pond, is referred to as the Absorption rate.
While the Real Estate Pond can summarize the activity for the last three months, the real value is in projecting the activity for the next three months. In areas where the sales are uniform across the year, the previous three months can be a great indicator of the next three months. However, we found that in most cases, cases where you have seasonal markets, the current Pond may not be a good reflection of what is about to happen. You can imagine a situation where we've just completed the end of a buying season. In that case, the pond for the previous three months shows plenty of activity. However, in a seasonal market, that won’t reflect the upcoming months.
To overcome this problem with seasonal markets, we created the Projected Pond. The Projected Pond is really a projection on what may happen in the upcoming three months. Now, that projection is based on the current rate of sales, and it is filtered with the Buying Pattern. What that really means, is that we’ve analyzed the results of the previous year’s data, to determine what percent did sell, in the next three months, a year ago. Then, we multiple that percent by the total projected sales for the upcoming year. In summary, and the way we describe it to our customers is, the projection is based on the current rate of sales, filtered with the Buying Pattern.

The number of homes projected to sell in the next three months is shown in the graphic, on the top right. In this graph, two homes are projected to sell in this area in the next three months. Of course, there is currently one home under contract, which will be one of the homes that will result in a sale. Thus, leaving one more home left to be sold. (By the way, we also project the number of new properties to come on the market in the same way. In the above example, we are projecting 3 new homes to come on the market in the next three months.) Of course, the actual data shown on this graph is based on the specific data for this specific time and location. In this case, this was the data that was exported and so this graph is customized and specific to match the customer profile.
So how do we make use of the Projected Pond?
We use it to help the customer see the upcoming supply and demand for their specific situation. This will be an important tool, when helping the customer determine their pricing strategy. In cases where there is a much bigger demand than there is supply, the seller may want to make use of a Listing Launch* type of pricing strategy. In cases where there is a much smaller demand than there is supply, the seller may want to make use of a more conservative pricing strategy.
To use the Projected Pond effectively, be sure to look at the last two years of activity (this improves the accuracy of the trend analysis) and be sure that the search really represents the buyer perspective. How do you do that? Put yourself in the buyer position. If a buyer is considering purchasing your property, what other properties might they be considering? In most cases, buyers are price sensitive and buyers considering the subject property will also be considering other properties in a wider area that are in a comparable price range.
In summary, we believe making use of the Projected Pond would be most helpful so that your customers can best see the upcoming supply and demand for their situation, and that the result of the graph will allow you to work with your customer to best determine your pricing strategy.
What is a Listing Launch?
The Listing Launch is a process in which a seller will list their property, which allows for several buyers to view the property, prior to looking at incoming offers. In many cases, when a home is listed, the seller will take the first offer that comes in and then evaluate that offer and respond to that buyer (usually by accepting the offer or by submitting a counterproposal to that buyer). However, in the Listing Launch scenario, the seller will list his home and then state (usually in the Multiple Listing Service comments) that the seller will evaluate all incoming offers at a specific time (usually 3-7 days after the property has been on the market). This has the advantage to allow several buyers to view the property rather than just the first buyer who walks in the door. From a seller perspective, it allows the seller to potentially view multiple offers to select the offer that best meets the Sellers needs. That being the case, you need to be sure that if you do the Listing Launch, that there is sufficient demand that warrants this strategy. Sometimes, this process can “turn off’ prospective buyers who don’t want to “complete” for a property, so that won’t submit an offer in this situation. Also, as a real estate professional, if you suggest the Listing Launch strategy and don’t get any offers in, it makes you look less professional (do you really know what’s going on?). The Projected Pond is a great tool to help you determine whether this strategy makes sense for your specific situation).